TRACEABILITY IN PAINT SHOP
System; It gives a standard metric for recognizing a problem in operations, determining what percentage of production time is truly productive, and being able to monitor business processes. When calculated and interpreted correctly, it can significantly maximize your production. It is also used as a benchmark to compare any production with industry standards, in-house equipment, or other shifts working on the same equipment.
Calculation and productivity visuals to be made within the scope of the project are not only a great tool for managers but can also have a significant impact on employees on the factory floor
Specified in the system;
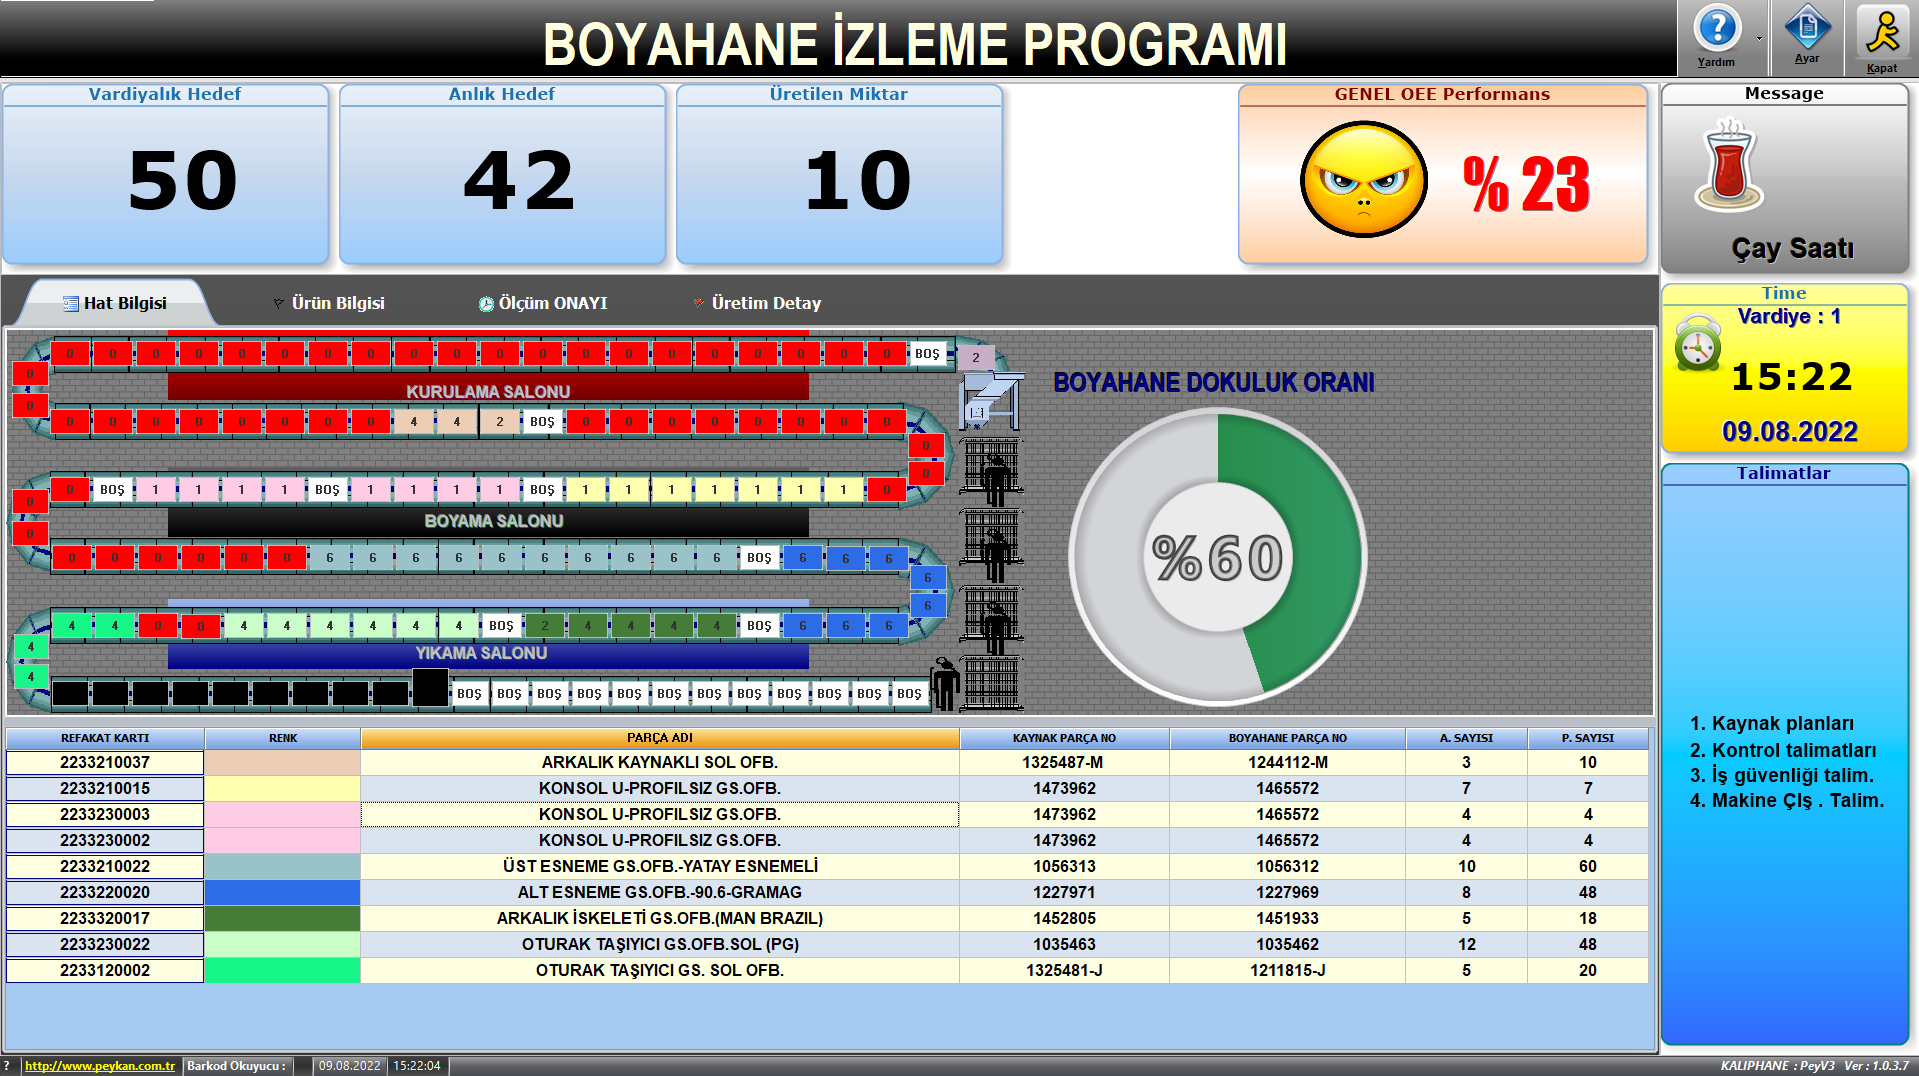
The traceability of the welding parts throughout the whole process (washing, painting, drying) is shown on the DYEHANE line. The empty and fullness of the products on the hangers in the paint shop is evaluated and the total occupancy rate in the line is displayed. In this way, the amount of work of the system and the machine and the movements of the hangers are displayed instantly. It is shown in which process and position the products on the hangers are in. The table contains data about the product. Such as the color on the screen, the part name, the hanger quantity, the number of parts. .
The shift target entered at the beginning of the shift or optionally the daily target amount is entered. The instant target is shown according to the product time used. Accordingly, the amount produced in the system is displayed and allows comparison. The difference is displayed instantly. Total OEE performance is permanently indicated on the main screen with emoji and numbers.
The screen also displays the product-based OEE calculation of the instant targeted production amount and the actual amount of each reference code product based on this data. The production time of all products is taken from the system and the calculation is made on this data.
5 Benefits of Using a System Solution